fbpx

The statistics of Thailand’s e-commerce market in 2022

    To learn the e-commerce spending behavior of Thai people, use the following summary of e-commerce market statistics in Thailand in 2022: from the Digital Stat 2022 report.

Weekly online shopping activities

Ecommerce

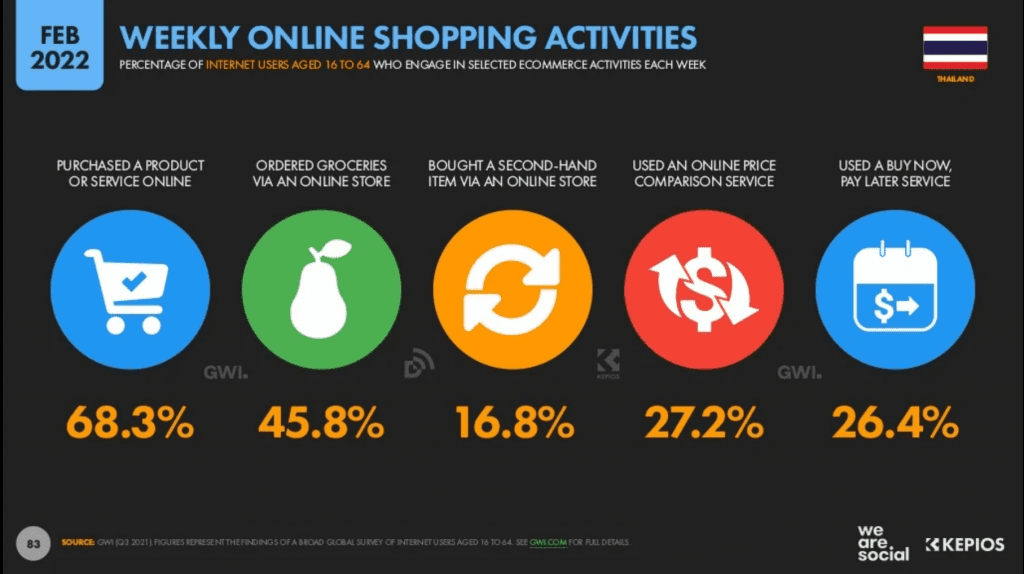
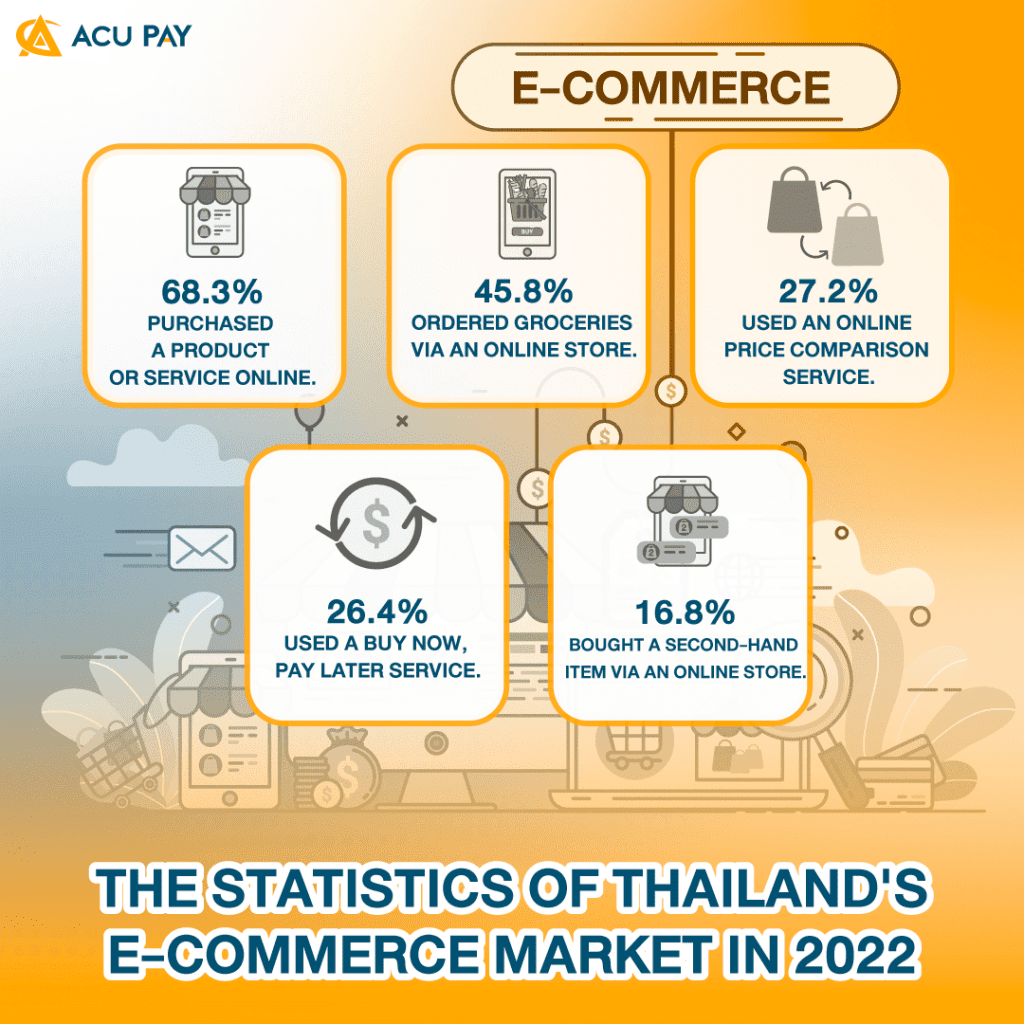
      According to the Digital Stat report, internet users aged 16–64 use e-commerce for the following activities:

  1. 68% purchased a product or service online.
  2. 45.8% ordered groceries via an online store.
  3. 27.2% used an online price comparison service.
  4. 26.4% used a buy now, pay later service.
  5. 16.8% bought a second-hand item via an online store.

15 factors make Thai people shop online.

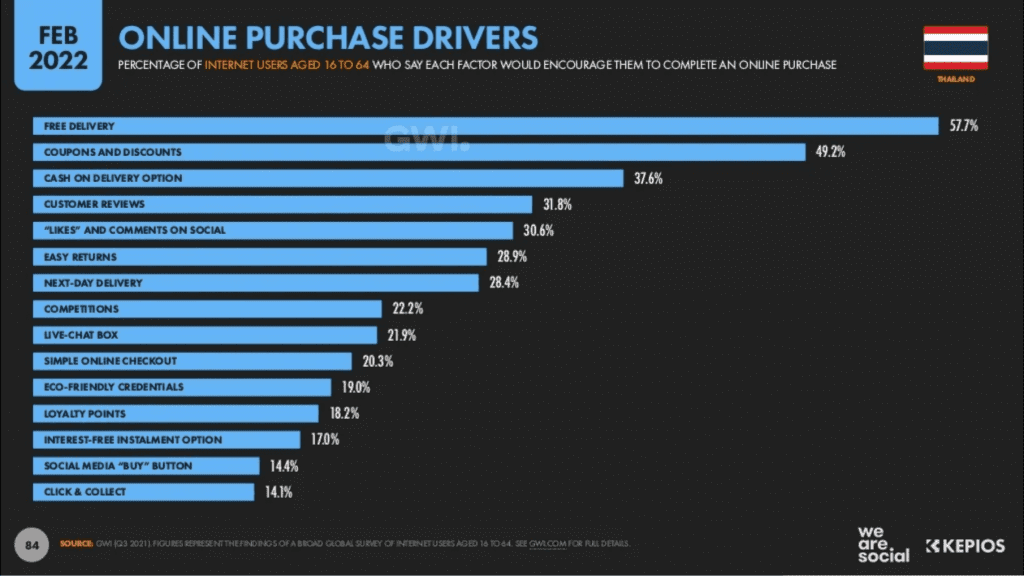
From the Digital Stat report, people aged 16–64 reveal the reasons why Thai people buy things online as follows:

  1. 7% FREE DELIVERY
  2. 2% COUPONS AND DISCOUNTS
  3. 6% CASH ON DELIVERY OPTION
  4. 8% CUSTOMER REVIEWS
  5. 6% ‘LIKES’ AND COMMENTS ON SOCIAL
  6. 9% EASY RETURNS
  7. 4% NEXT-DAY DELIVERY
  8. 2% COMPERITIONS
  9. 9% LIVE-CHAT BOX
  10. 3% SIMPLE ONLINE CHECKOUT
  11. 0% ECO-FRIENDLY CREDENTIALS
  12. 2% LOYALTY POINTS
  13. 0% INTE REST-FREE INSTALMENT OPTION
  14. 4% SOCIAL MEDIA “BUY” BUTTON

overview and cost of purchasing consumer goods through e-commerce.


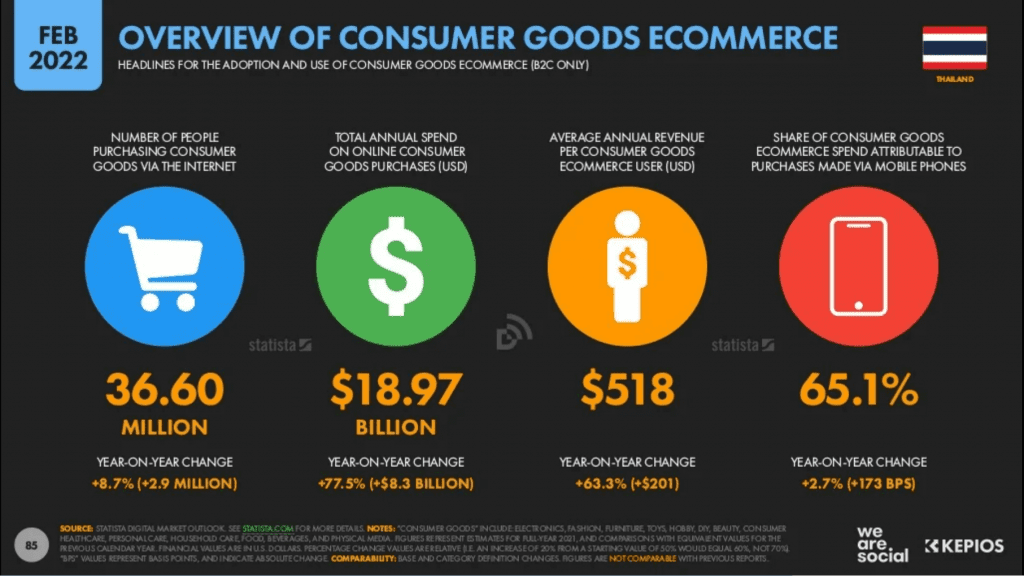
According to the Digital Stat report, there were 36.60 million people buying consumer goods through e-commerce, an increase of 8.7%, representing 2.9 million people from last year, representing approximately 639,289,000 million baht, an increase of 77.5%, representing 279,710 billion baht, an average of 17,456.6 baht per person. an increase of 63.3%, representing 6,773 baht from last year. By spending via mobile phones, up to 65.1%, an increase of 2.7% from last year.

The value of consumer goods purchased through e-commerce is divided by product type.

e-commerce
  1. Electrical appliances have a spending value of 213,658 million baht, an increase of 40.2% from last year, or a value of 134,126 million baht.
  2. Skincare has a spending value of 134,126 million baht, an increase of 85.8% from last year, or a value of 64,030 million baht.
  3. Beverages and drinking water with a spending value of 130,419 million baht, an increase of 159% from last year, or a value of 80,880 million baht.
  4. Clothing and fashion products with a spending value of 50,550 million baht, an increase of 85.8% from last year, with a value of 23,320 million baht.
  5. Toys have a spending value of 47,180 million baht, an increase of 99.3% from last year, or a value of 23,455 million baht.
  6. Food has a spending value of 42,799 million baht, an increase of 100% from last year, with a value of 21,365 million baht.
  7. Furniture has a spending value of 15,994 million baht, an increase of 54.2% from last year, or a value of 5,627 million baht.
  8. IT equipment has an expenditure value of 4,896 million baht, an increase of 14.4% from last year, with a value of 606 million baht.

**Based on the exchange rate 33.7 baht/dollar

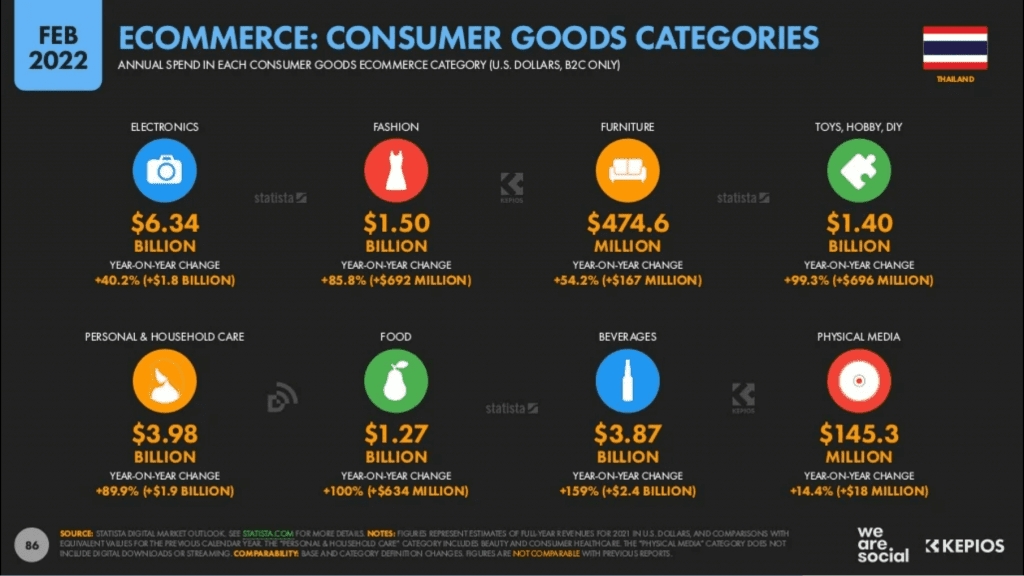
      Drinks and food have very interesting numbers, with double the number of online purchases and spending. It may be caused by COVID-19 which has caused a significant increase.

      And buying electrical appliances online reflects the behavior of buyers who have more confidence in online shopping Because electrical appliances are products that most people like to try or test before making a purchase. Possibly with improved warranties and shipping. This gives consumers more confidence in online purchases. It can be reflected in the factors that make consumers order products online.

Source : https://datareportal.com/reports/digital-2022-thailand